There is a bend on the road I drive most mornings where nearly every driver taps the brakes. No sign tells them to. No light hangs over it. But something happened on that curve a long time ago, in the shared memory of the town, and now the brake lights blink at the same spot day after day. The road is not magic. The drivers are reacting to a place that has meant something before.
Gold has bends like that. Traders call them supply and demand zones on XAU/USD, prices where the market slowed, flinched, or turned before. In my first years I drew lines all over the gold chart with nothing underneath them. Some worked, and I called myself smart. Some failed, and I called it bad luck. What I never had was a reason.
Guessing gets expensive fast once real money is on the answer. Back in 2017 I owed money to a man who counted interest by the day, and I traded gold to climb out. A wrong guess back then cost me more than I could afford. That year taught me the hard way that a chart owes you nothing for a line you cannot explain.
This post is about giving your lines a reason. We are going to find the places on gold where price has already shown its hand, the spots where buyers or sellers stepped in hard the last time. But I want to be straight from the first paragraph. A zone is a waiting room, not a promise. Gold can walk straight through it without slowing down. If you remember one thing from this page, remember that.
This sits inside a bigger process. If you have not read how to read gold, step by step, start there, because zones are only useful after you have the big picture and the market structure in front of you. A zone with no context is just a box on a chart.
What a supply or demand zone actually is
Picture a busy street with a small coffee shop. Every morning at eight, a crowd forms outside. When you walk past at 7:55 and see people already gathering, you can guess the door is about to open. You are not sure. Maybe it stays shut today. But the crowd is a clue that something happened here before.
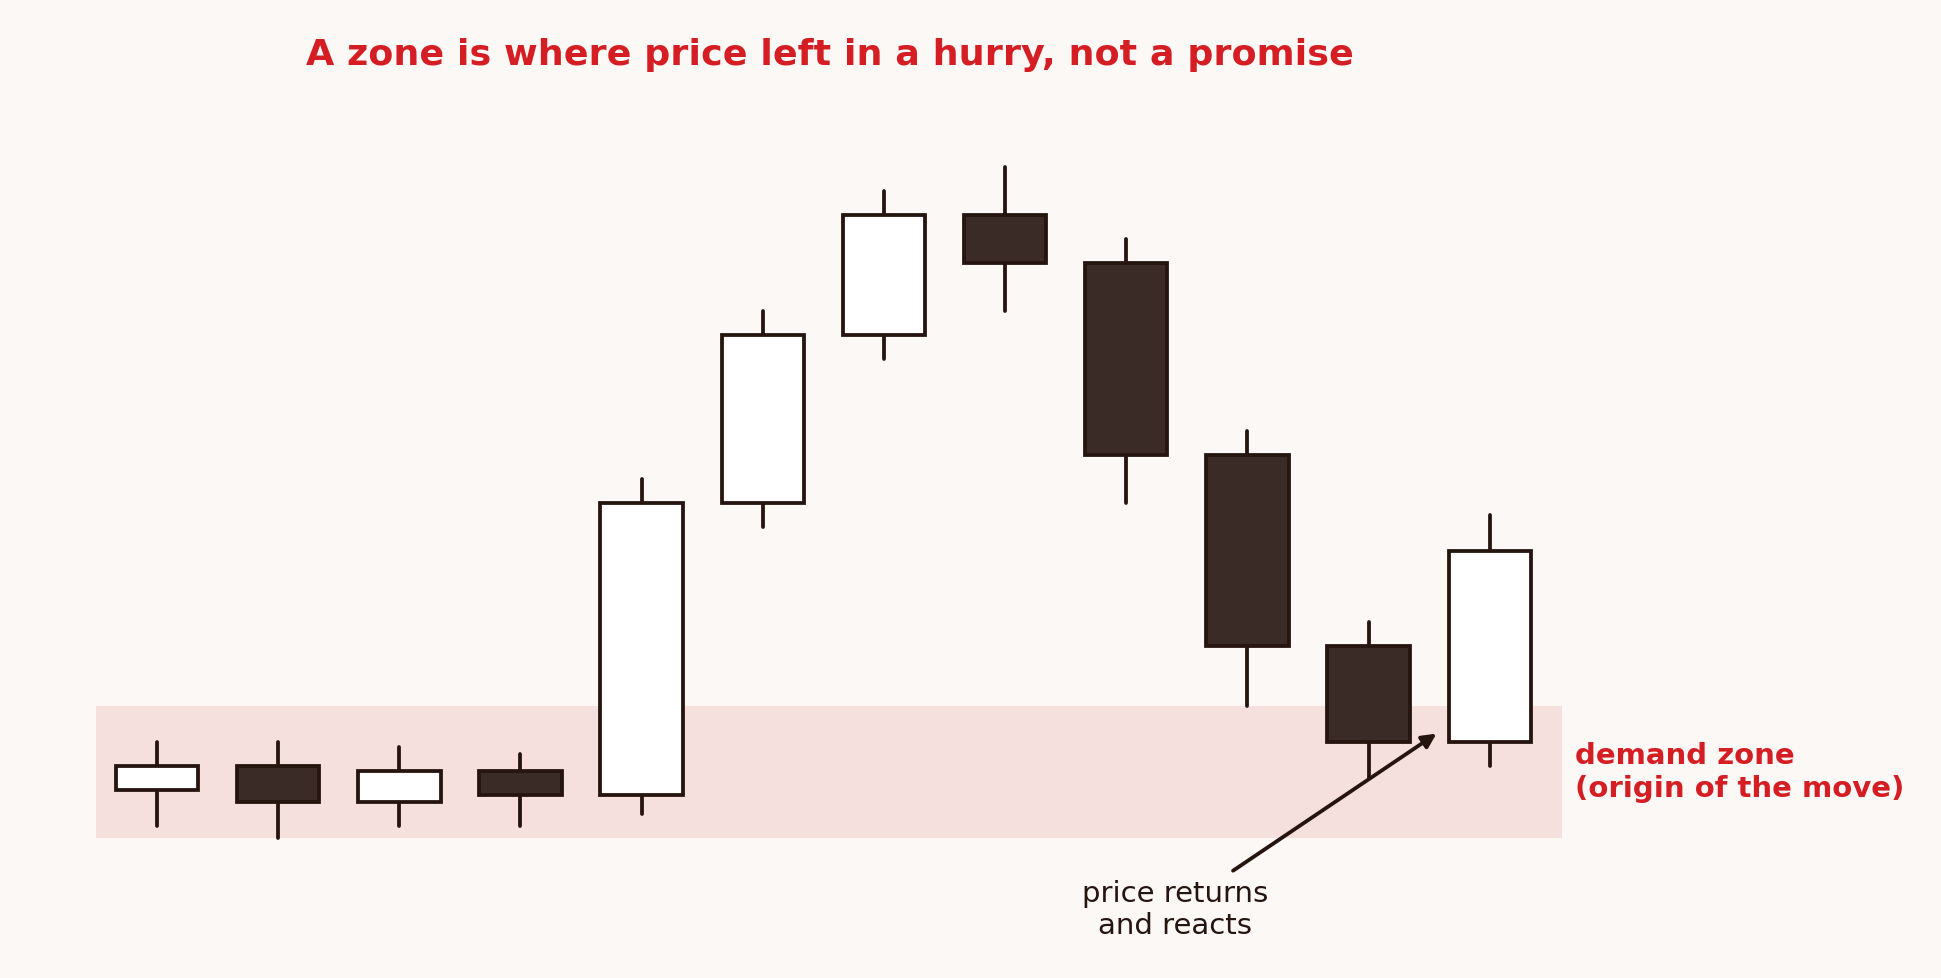
A demand zone on gold is that crowd. It is a price area where buyers showed up in force. On the chart it looks like a spot where price dropped, paused, then launched up fast. That fast launch is the fingerprint. It means orders were sitting there, and when price arrived they got filled and shoved the market away.
A supply zone is the mirror image. Price rose, stalled, then fell hard. Sellers were waiting.
Watch what I am doing. I am not drawing a zone because the price is a round number, or because an indicator told me to. I am drawing it where the market itself already reacted with force. The zone is the memory of a fight that buyers or sellers won. When price comes back to that area, some of those players may still be interested. It marks a place worth watching, nothing more.
How to mark a zone on gold, step by step
The method I use is deliberately dull, and dull is good. A quiet routine repeats without drama.
First, find the strong move. Scroll your gold chart on a higher timeframe, the four hour or the daily, and look for a candle or small group of candles that traveled a long way quickly. Long body, little wick against the direction of the move. That is your sign of force. No strong move, no real zone.
Second, find the base. Just before that strong move, there is usually a small pause. One, two, maybe three quiet candles bunched together. That tight little cluster is the origin, where the orders were resting.
Third, draw the box. Put the top and bottom of your rectangle around that small base, not around the big candle. Extend the box to the right so you can see when price returns to it.
Fourth, rank it. A zone that sent price a long way is more interesting than one that sent it a short way. A zone nobody has touched since it formed is cleaner than one price has already revisited three times.
Strong move, find the base, box the base, rank it. You are marking history, not predicting the future.
Fresh versus used, and why freshness matters
My single most useful filter is this: was the zone born from a strong move, and has price left it alone since?
A fresh demand zone that launched gold a long way and has not been retested still has orders sitting in it. That is the crowd outside the shop that has not gone in yet. A used zone is different. Each time price dips in and bounces, some of those resting orders get filled and used up. By the third visit, the crowd may have mostly gone inside, so the box is still there but the fuel behind it is thinner. When two zones sit near the same price, I lean toward the fresher one. Not because it is guaranteed, nothing here is, but because it has a cleaner story.
An everyday example on XAU/USD
Say gold falls into an area near a round number. Let me use 2,300 dollars, and to be clear, this is only a way to picture the thinking, not a forecast and not a signal. From there it climbs a couple hundred dollars over the next day. You mark the little base it left behind, say the box sits between 2,298 and 2,305. A week later, price drifts back toward that box.
Now you are the person walking past the coffee shop at 7:55. You do not throw your money at the door. You slow down and watch. Does price arrive tired, or fast? Does it hesitate inside your box, or keep falling like the box is not even there? Your zone did not tell you to buy. It told you where to start paying real attention. The decision comes later, once you add a trigger and a defined risk. That number, 2,300, is not special. It is a picture of the thinking, nothing more.
A quick, honest note. Trading gold, XAU/USD, is high risk. It is usually traded with leverage, and leverage magnifies your loss as much as your gain. On a fast move or a price gap, your loss can be larger than the amount you deposited. Everything here is education, not personal financial advice. Make your own decisions and risk only money you can afford to lose.
When a zone is just an empty box
I promised you the other side of every technique, so here it is, and this part matters more than the method itself.
Zones fail all the time. Price can cut straight through a demand zone and never look back. When that happens, it usually means the story changed. Maybe a news event hit, and the buyers who once defended that area have quietly walked away. The crowd outside the coffee shop went home and you did not see them go. Your box is still on the chart, still looking meaningful, but empty.
Zones also fail because you drew them badly. Box the giant candle instead of the small base, and your zone ends up too wide and too late. Call every little wiggle a zone, and you will have twenty boxes on the screen and no clarity at all. More lines do not mean more insight. They mean more noise.
And zones fail because of a trap in your own head. Once you draw a clean box, you start wanting price to respect it. That is backwards. The zone is a question, not an answer.
The worst version of this trap is drawing the zone after the fact. Gold makes a move, you feel like you missed something, and you scroll back and put a box exactly where it would have made you right. That is not reading the chart. That is decorating a feeling. A zone only counts if you drew it before price came back, while the outcome was unknown. If you catch yourself drawing boxes to justify a trade you already want, stop. You have started praying to the chart instead of reading it, and I have prayed to charts. It is not a strategy.
This is why everything I do is built on risk first. A zone is never a reason to enter with your eyes closed. It is a reason to prepare.
Deciding when a zone is dead
Because zones fail, you need to decide in advance what “failed” looks like, before any money is on the line. This is the single most useful habit on this page, and almost nobody does it.
For every zone you draw, write one sentence: this zone is invalid if price does this. For a demand zone, a simple version might be, “This zone is dead if a four hour candle closes fully below the bottom of my box.” Not a wick poking through. A full close beyond it. You pick the rule first, while you are calm, before the live move arrives.
Why write it down? Because in the moment, price will make you negotiate. It will dip below your box and you will tell yourself, “That is just a fakeout, it will come back.” Sometimes it does. But the trader who decided the rule in advance does not argue with himself while the candle is still forming. The zone held, or it is dead. That calm is worth more than any single trade.
If you want a simple way to keep this habit, my free one-page checklist, The Gold Read Card, has a line for exactly this. More on how to grab it below. No pressure either way.
Where supply and demand zones on XAU/USD fit in the read
A zone by itself feels a little lonely. It tells you where, but not really when. Gold behaves differently at nine in the morning in London than on a sleepy afternoon, and the same box can come alive or stay silent depending on the clock. That is why the next step is time. Learn how gold trades by session, so you know whether your box is about to meet a real crowd or an empty street.
And a zone is still only one clue. It becomes something you can act on when it lines up with things you trust: structure agreeing with it, the right session, a trigger that shows the crowd turned up. See how to combine confluence and a trigger so a zone becomes part of a full read.
Trade the process, not the guess.
Your small exercise
Open your gold chart on the four hour timeframe now. Reading about this and doing it are two different skills.
- Find two or three of the strongest moves in the last few weeks. Long body, quick travel.
- Mark the small base each one came from. Box that base, not the big candle.
- Label each box as fresh or already tested.
- Under each box, write one sentence: “This zone is dead if ______.” Fill the blank with a specific price behavior, like a full candle close beyond the box.
- Do nothing else. Do not trade them. Just watch how price treats each box when it returns, if it returns at all.
You will learn more from three well drawn zones than from thirty sloppy ones. I still run this exercise myself.
Keep the whole read on one page
If marking zones this way makes sense to you, the harder part is doing it in order every session, without skipping steps when you are tired or excited. That is what my book Reading Gold: A Repeatable Method for XAU/USD is for. It walks the full read in a fixed order, from the big picture down to a defined-risk entry, with zones in their proper place. No secret setup, just a process you can repeat.
If you would rather start small, grab The Gold Read Card, my free one-page pre-trade checklist. It covers context, structure, zone, session, confluence, risk, and trigger, so you run your eyes down it before every trade instead of trusting your memory. Free, no pressure.
And if you want company while you practice, the door to the HARCOS INVEST FX community is open. It is not a room full of winners. It is a room full of gold traders willing to show their work, including the losing and cancelled trades. No rush, no last chance. If you would rather practice quietly on your own, that is a good path too.
FAQ
What is the difference between a supply zone and a demand zone on gold?
A demand zone is a price area where buyers stepped in hard, so gold dropped, paused, then launched up fast. A supply zone is the opposite: gold rose, stalled, then fell hard as sellers took over. Both mark places where the market already reacted with force, not places where it must react again.
How do I know which zones on XAU/USD actually matter?
Favor zones born from a strong, fast move, and favor fresh zones price has not revisited yet. A zone that launched gold a long way and has been left alone has a cleaner story than one tested three times. But even the best zone is a waiting area, not a promise.
Why did price cut straight through my perfect demand zone?
Because the story changed. A news event, a shift in structure, or buyers simply walking away can empty a zone while your box still looks meaningful. This is normal. It is why you decide in advance what would tell you the zone is dead, and why risk comes before the setup.
Can I draw a zone after price already reacted?
You can, but it teaches you nothing and it fools you. A zone only counts if you drew it before price came back, while the outcome was unknown. Drawing boxes after the fact to justify a trade you already want is decorating a feeling, not reading the chart.
About the author
My name is Marcus, founder of HARCOS INVEST FX. I did not come from money or from a trading desk. I came from a bad year and a loan I could not pay. In 2017 I blew up a trading account while I was already in debt, and I learned the hard way that being clever about gold means nothing if you cannot control what you lose. The thing that saved me was boring. I put risk first and built a process I could repeat. I am not a guru, and I will never tell you I found a way to get rich fast, because I did not, and neither has anyone telling the truth. Trade with me, not for you.
Risk note: Trading gold (XAU/USD) is high risk and uses leverage, so your losses can exceed your deposit. This article is education, not personal financial advice. Risk only what you can afford to lose.